







The 3 Financial Ratios That Tell You If a Stock Is Actually Worth Buying

The 3 Financial Ratios That Tell You If a Stock Is Actually Worth Buying

Most people pick stocks based on hype, headlines, or gut feeling. That is a gamble, not investing. The investors who consistently make money do something different. They read numbers. Specifically, they read three numbers before they buy anything.

These are not obscure formulas used only by Wall Street analysts. They are ratios anyone can calculate. Better yet, most financial platforms publish them automatically. The skill is knowing what they mean and how to use them together.

Why Ratios Matter More Than Stock Prices

A stock price alone tells you nothing useful. A $10 stock can be wildly overpriced. A $500 stock can be a steal. Price is just the number someone last paid. Ratios reveal whether that price makes sense.

Financial ratios help investors quickly assess a company’s market value. They can be compared over time and across industry peers. Some figures come from financial statements, others from market prices and analyst forecasts. Used together, they tell you where a company stands relative to its valuation.

Think of ratios as a health check before you commit. You would not buy a car without checking under the hood. Do not buy a stock without checking these three.

Ratio #1: The Price-to-Earnings Ratio (P/E)

This is the starting point for almost every stock analysis conversation. The price-to-earnings ratio  also called the “multiple”  is quite possibly the most frequently cited stock ratio.

The formula is straightforward. Divide the stock’s current share price by its earnings per share (EPS). EPS is the company’s net income divided by its total number of outstanding shares.

So if a stock trades at $100 and earns $5 per share, the P/E is 20. That means you are paying $20 for every $1 of annual earnings the company produces.

A forward P/E is based on the current stock price relative to estimated EPS for the next year. This indicates how expensive future earnings are at current prices. It is a useful lens for growth-oriented companies still scaling their profits.

What’s a good P/E? Context is everything here. The simplest way to determine whether a P/E is high or low is to compare it against other companies in the same sector and against the P/E of an appropriate benchmark index.

The S&P 500’s long-term average P/E sits around 18. The forward P/E for the S&P 500 is closer to 21, based on Wall Street’s earnings projections for the next 12 months. (Henssler Financial)

A P/E of 10 in a sector where peers average 25 could signal undervaluation. Or it could signal trouble. That is why the P/E is never the only ratio you look at.

The key limitation: P/E ratios are backward-looking when trailing, and speculative when forward. A high P/E is not automatically a red flag if the company is growing fast. A low P/E is not automatically a buy signal if earnings are falling.

Ratio #2: The Price-to-Book Ratio (P/B)

Where P/E measures earnings, P/B measures assets. It compares what the market is willing to pay against what the company actually owns on paper.

The P/B ratio compares a company’s market valuation to its accounting value. Book value represents what would theoretically remain if a company liquidated all assets and paid all liabilities.

The formula: divide the stock’s share price by its book value per share. A P/B ratio of 1.0 means the stock trades at exactly its book value. Anything above 1.0 means the market is pricing in brand strength, earnings potential, or competitive advantage beyond what the balance sheet shows.

A P/B ratio below 2.0 could signal value. Below 1.0 is considered deep value territory. But the threshold matters by sector. (Britannica Money)

The P/B ratio is particularly useful for industries like banking and manufacturing, where cash and physical assets like property and equipment play a major role. For tech or consumer brands, where value sits in intellectual property and brand loyalty, P/B becomes less reliable.

When JPMorgan Chase trades at a P/B of 1.5, investors are paying 1.5 times the bank’s accounting value. When Nestlé trades at a P/B of 6.0, investors are paying six times its book value. The gap reflects how much intangible value the market assigns to each business.

The key limitation: Book value can be misleading if assets are not regularly revalued. It also excludes intangibles like brand equity and patents, which are often a company’s most valuable assets.

Ratio #3: The Debt-to-Equity Ratio (D/E)

The first two ratios help you judge price. This one helps you judge risk.

The debt-to-equity ratio is derived from two components: total debt and shareholders’ equity. It is crucial for evaluating a company’s financial risk. A higher ratio indicates the company relies more heavily on borrowed money.

The formula: divide total debt by total shareholders’ equity. If a company reports total liabilities of $150 billion and shareholders’ equity of $50 billion, the D/E ratio is 3.0 meaning $3 of debt for every $1 of equity.

Most experts recommend investing in companies with a D/E ratio of up to 2. Anything beyond 2:1 is considered too high, as it puts the company at risk of bankruptcy. (Fi Money)

Why does this matter when evaluating a stock? Because debt amplifies both gains and losses. During a downturn, highly leveraged companies struggle to service interest payments. This erodes earnings, hurts cash flow, and in extreme cases, triggers insolvency.

A high D/E ratio may deter conservative investors, while those with a higher risk tolerance might see it as an opportunity for greater returns. Neither stance is wrong. The point is knowing what you are stepping into.

The key limitation: D/E ratios vary significantly by industry. Utility companies and banks routinely carry higher debt levels by the nature of their business models. Always compare a company’s D/E against its industry average, not a universal benchmark.

Using All Three Together

Each ratio is a lens. None of them alone gives you the full picture. The real skill is using them in combination.

Here is a quick reference for what each ratio signals at a glance:

Ratio Low Reads As High Reads As Most Useful For
P/E Potentially undervalued Growth expectations priced in Earnings valuation
P/B Deep value opportunity Strong market confidence in growth Asset-heavy companies
D/E Low financial risk High leverage, higher risk Assessing debt exposure

And here is how the signals combine when you read all three together:

Signal P/E P/B D/E What It Suggests
Worth investigating Low Below 2 Under 2 Undervalued with manageable risk
Proceed with caution High Above 5 Above 3 Growth assumptions must hold

Neither row is a guaranteed outcome. A high-growth company can justify every number in the second row. A struggling business can sit comfortably in the first place. The table gives you a starting filter, not a final verdict.

Although financial ratio analysis cannot reveal everything important about a company, it helps to see just enough of the road ahead to decide where to go and whether to speed up or slow down. (Charles Schwab)

The Habit That Separates Disciplined Investors

Most retail investors skip this step entirely. They chase momentum, earnings headlines, and social media sentiment. Some of them get lucky for a while.

Consistent investors build a process. They check these three ratios before every buy. They compare numbers to the sector average, to historical figures, and to competitors. They look for convergence, where all three ratios point in the same direction.

This is not about finding perfect stocks. Perfect stocks do not exist. It is about stacking the odds in your favor before you commit capital.

The numbers are public. The formulas are simple. The discipline is the hard part.

Sources: Charles Schwab | Britannica Money | Henssler Financial | Fi Money


Post Disclaimer

The information provided on Financepdia.com is for educational and informational purposes only and should not be considered financial, investment, or trading advice. Cryptocurrency and financial markets are highly volatile and involve significant risk. Readers should conduct their own research (DYOR) and consult with a qualified financial advisor before making any investment decisions. Financepdia.com and its authors are not responsible for any financial losses resulting from actions taken based on the information provided on this website.
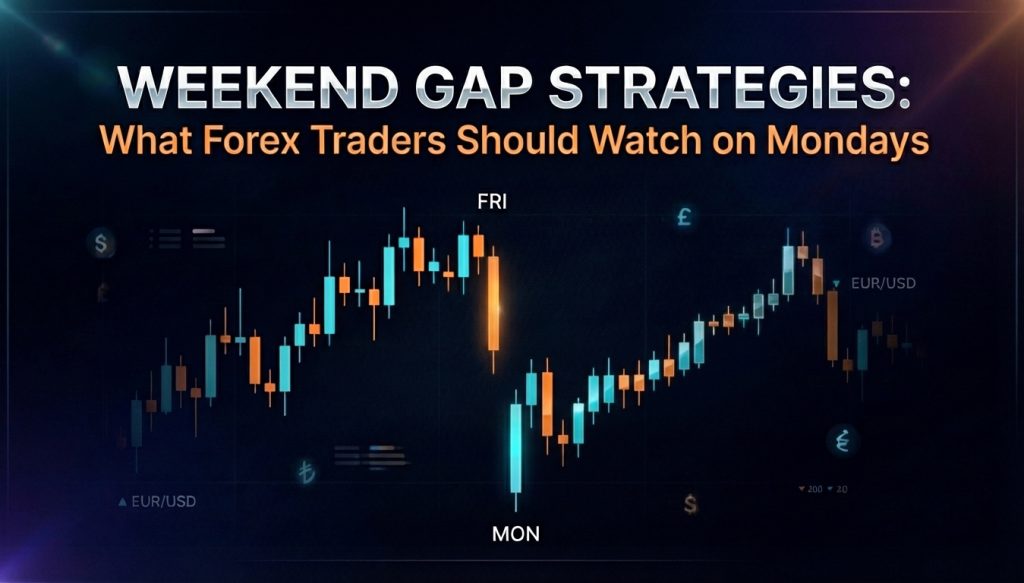

Weekend Gap Strategies: What Forex Traders Should Watch on Mondays

Weekend Gap Strategies: What Forex Traders Should Watch on Mondays

Can a calm weekend in crypto hide the kind of Monday move that catches a forex trader off guard? 

That question matters more than many new traders think. A quiet chart on Friday can turn into a sharp jump by the Monday open when fresh orders hit the market. For a crypto focused reader, the lesson feels familiar. News never really stops, and price can react fast when liquidity comes back.

In forex gap trading, the main weekly gap appears between the Friday close and the Monday open because retail trading pauses over the weekend while global events keep moving. A gap can open higher or lower than Friday’s last traded price. Also, that move can trigger fear, fast entries, or bad exits if the trader has no plan.

What a Weekend Gap Really Says

A weekend gap is not random noise. It often reflects new information that hit the market while forex trading was closed. That can include political news, central bank talk, election results, conflict headlines, or a sudden shift in market mood. So, the first job on Monday is not to chase price. The first job is to read what the gap is saying.

A small gap in a quiet pair may mean little. A large gap in EUR/USD, GBP/USD, or USD/JPY can point to strong order flow at the open. However, size alone is not enough. The trader still needs to check whether price starts to pull back toward Friday’s close or keeps moving in the gap direction.

That difference matters. Some Monday gaps move back toward the prior close, which traders often call a gap fill. Meanwhile, other gaps keep running because the weekend event changed sentiment in a real way.

Why Monday Needs a Different Mindset

Monday is not just another session. Early trading can have wider spreads, thinner liquidity, and quick fake moves before London volume comes in. As a result, traders who jump in during the first few minutes often pay a high price for poor timing.

For crypto readers, this is a familiar setup. Weekend emotion can build a strong story before real liquidity returns. In forex, that story gets tested when the market opens, and bigger players start showing their hand. So, patience often beats speed on Monday morning.

A smart trader watches the first reaction, not just the first print. If price gaps up and then stalls under a key level, buyers may be weak. However, if the price gaps down and then cannot push lower, sellers may lose control.

Monday Gap Signals Traders Should Track

The table below shows what matters most during the Monday open.


What to Watch What It Can Mean What a Trader Should Do
Gap size A bigger gap can signal stronger news or stronger emotion Compare the gap with recent Monday opens
Pair selection Major pairs often react cleaner than thin pairs Focus on EUR/USD, GBP/USD, and USD/JPY first
Spread at open A wide spread can ruin entry quality Wait for the spread to calm before acting
Friday close level This is the key line for a possible gap fill Mark it before the market opens
First 30 to 60 minutes Early candles show whether the move is accepted or rejected Let price show direction first
Weekend news flow News often explains whether the move may continue Check the economic calendar and headlines
Risk per trade Gaps can skip normal exits Cut position size and keep a hard risk limit


A Simple Monday Plan That Makes Sense

A trader can start by marking three prices before the open. The first is the Friday close. The second is the Monday open. The third is the nearest support or resistance level on the four-hour chart. Also, that quick map helps remove guesswork.

Next, the trader should check the weekend news and the economic calendar. If the gap came after major news, a full reversal is less likely. If there were no strong driver, the chance of a gap fill may be higher.

Then comes the key question. 

Is the price accepting the new level, or rejecting it? 

If candles hold above the gap area after a gap up, continuation may be the stronger idea. However, if the price quickly drops back into Friday’s range, the market may be trying to close the gap.

Risk control matters more than the entry. A trader should keep position size small, especially during the first hour. Stop placement also needs space because Monday volatility can be messy. A tight stop loss placed in panic often gets hit before the real move starts.

When the Best Trade Is No Trade

Not every weekend gap deserves action. Some are too small to matter after the spread cost. Others are so large that the reward-to-risk picture looks poor from the start. So, skipping weak setups is part of the strategy, not a failure.

This is where many newer traders slip. They see a dramatic price action move and think a trade must be taken at once. In reality, a clean no-trade decision can protect the account far better than a forced entry.

Another warning sign is conflict between time frames. If the daily chart is in a strong uptrend, fading a small gap up can be risky. Meanwhile, trading with the bigger trend often gives the price more room to work.

Monday Gaps Reward the Prepared Trader

The real edge in weekend gap strategies does not come from guessing. It comes from reading context, waiting for structure, and respecting risk. A trader who marks the Friday close, watches the Monday open, checks the news, and waits for spreads to settle already stands in a better spot than the crowd.

For a crypto audience, the lesson is clear. Weekend emotion can shape Monday action across markets. In forex, that action becomes sharp and visible at the open. So, the trader who stays calm, keeps size under control, and reacts to proof instead of fear has the better chance over time.

Disclaimer: This article is for educational purposes only and does not give financial advice. Trading forex and crypto carries risk, and losses can exceed expectations.


Post Disclaimer

The information provided on Financepdia.com is for educational and informational purposes only and should not be considered financial, investment, or trading advice. Cryptocurrency and financial markets are highly volatile and involve significant risk. Readers should conduct their own research (DYOR) and consult with a qualified financial advisor before making any investment decisions. Financepdia.com and its authors are not responsible for any financial losses resulting from actions taken based on the information provided on this website.

Best Passive Income Ideas That Can Generate Monthly Cash Flow

Best Passive Income Ideas That Can Generate Monthly Cash Flow

Can crypto still help build a monthly cash flow without watching charts all day or chasing the next hype coin?

That is the question many beginners and careful investors keep asking. They want passive income ideas that feel real, simple, and worth the risk. They also want income that can grow over time, not just one lucky trade.

For a crypto audience, the answer is yes, but only with the right plan. Crypto passive income is no longer just about buying a token and hoping it pumps. Today, it is more about picking systems that pay rewards for holding, staking, lending, or adding liquidity. However, not every option is safe, and not every yield lasts.

This article breaks down the best passive income ideas that can generate monthly cash flow for crypto-focused readers. It keeps the focus on methods that match the article title, reader intent, and current market behavior. As a result, readers can see which choices fit a beginner, which fit a higher-risk investor, and what to avoid.

Why Crypto Passive Income Still Gets Attention

Many investors want income without daily trading stress. That is why terms like crypto passive income, staking rewards, DeFi lending, yield farming, and monthly cash flow keep showing up in beginner searches and crypto guides. Recent educational pages from Coinbase on staking, Coinbase on crypto rewards, and Lido’s liquid staking page show that staking and reward-based models remain central to this space.

At the same time, regulators still warn that crypto yield products can carry serious risk. The U.S. investor bulletin on crypto interest-bearing accounts and the broader crypto asset securities alert both stress that losses can happen and investor protections may be limited. So, the smart path is not chasing the highest APY. It is choosing a method that fits the investor’s risk level.

Best Passive Income Ideas for Monthly Cash Flow in Crypto

1. Staking Blue-Chip Proof-of-Stake Coins

For many readers, staking is the cleanest starting point. A holder locks or delegates coins such as ETH, SOL, ADA, or ATOM and earns rewards for helping the network run. Coinbase explains staking as a way to earn rewards by putting crypto to work on a blockchain, and Lido shows how liquid staking lets ETH holders earn while keeping a usable token like stETH.

This method works best for investors who already plan to hold major proof-of-stake assets. In addition, it feels easier to understand than more advanced DeFi plays.

Why it works for monthly cash flow: rewards often build daily or over time, and they can be withdrawn or tracked as a recurring income stream.

2. Liquid Staking for More Flexibility

Traditional staking can lock funds. That is where liquid staking stands out. Lido states that users can stake ETH and receive stETH, which stays usable in the wider market while still reflecting staking rewards. Therefore, this can suit investors who want yield but also want room to move capital later.

Still, this option adds smart contract risk and token price tracking risk. So it is better for readers who understand basic DeFi wallets and on-chain tools.

3. DeFi Lending

Another strong option is DeFi lending. In simple terms, an investor deposits crypto into a lending market and earns interest when borrowers use that pool. This is one of the main models behind earn interest on crypto content across the market, and Coinbase’s rewards guide lists lending as one of the common reward paths in crypto.

This can work well with stable assets or large-cap crypto. Even so, readers should remember that lending has platform risk, token risk, and market stress risk.

4. Yield Farming and Liquidity Pools

Yield farming can create stronger returns, but it is not beginner-friendly. Investors add token pairs to liquidity pools and earn trading fees plus possible token rewards. Webopedia’s current guide notes that yield farming income often comes from transaction fees and incentive tokens, while also warning about impermanent loss.

This is a real passive income idea, but it should sit lower on a beginner’s list. For that reason, it fits readers who already know how DeFi pairs, pool ratios, and fee income work.

Quick Comparison Table


Passive income idea Best for Income style Main risk
Staking Beginners and long-term holders Steady reward flow Token price drops
Liquid staking Investors who want flexibility Staking rewards plus token mobility Smart contract risk
DeFi lending Moderate-risk investors Interest from borrowed funds Platform and borrower risk
Yield farming Advanced DeFi users Fees plus token rewards Impermanent loss and volatility


What Makes One Option Better Than Another

The best passive income idea is not the one with the loudest APY. It is the one that can still make sense after fees, taxes, price swings, and risk. A careful investor often starts with staking rewards on quality assets before moving into DeFi lending or yield farming.

Likewise, monthly cash flow in crypto should not be judged by payout speed alone. A method may pay often, but if the asset drops hard, the income does not help much. That is why simple, repeatable systems often beat flashy ones.

The Smart Way to Think About Monthly Cash Flow

A crypto investor who wants a monthly income should think in layers. One layer can be staking on major proof-of-stake coins. Another layer can be a smaller share in liquid staking or DeFi lending. Higher-risk methods, such as yield farming, should stay small unless the investor already knows the mechanics well.

Most importantly, passive income in crypto is still tied to market risk. It is income, but it is not fixed salary income. That mindset helps readers avoid poor choices.

Final Thoughts: Build Cash Flow Without Chasing Hype

The best passive income ideas that can generate monthly cash flow in crypto are the ones built on clear use, simple logic, and controlled risk. For most readers, that means starting with staking, learning how liquid staking works, and only then looking at DeFi lending or yield farming.

That path may look slower. Yet, slower often wins in crypto. A reader does not need ten income streams. A reader needs one or two solid systems that can be understood, tracked, and improved over time.

Disclaimer: This article is for educational purposes only and does not give financial, legal, or tax advice. Crypto assets are risky, volatile, and can lead to loss of capital. Readers should do their own research before making any decision.


Post Disclaimer

The information provided on Financepdia.com is for educational and informational purposes only and should not be considered financial, investment, or trading advice. Cryptocurrency and financial markets are highly volatile and involve significant risk. Readers should conduct their own research (DYOR) and consult with a qualified financial advisor before making any investment decisions. Financepdia.com and its authors are not responsible for any financial losses resulting from actions taken based on the information provided on this website.