


Have you ever watched a good trade crash after a news event? You are not alone.
The forex market moves $9.6 trillion every single day. That number comes from the 2025 BIS Triennial Survey. It grew 28% from $7.5 trillion in 2022. Most of that money flows between banks and hedge funds. Retail traders make up just 2.5% of total volume, according to CompareForexBrokers.
Here is the hard truth. Data from ESMA shows 74% to 89% of retail CFD accounts lose money. NFA filings in the U.S. show only 25% to 30% make money each quarter. One big reason? Traders rely on just one form of analysis.
Using both gives you the full picture. Fundamentals tell you what to trade. Technicals tell you when to get in and out.
Key Takeaways
- Fundamentals set direction. GDP, interest rates, and jobs data reveal currency strength.
- Technicals sharpen timing. Moving averages, RSI, and support levels pinpoint entries.
- Combined analysis boosts confidence. When both methods agree, the trade has a better chance.
- Risk management improves. You can set smarter stop-losses using both chart levels and event calendars.
- Most pros use both methods. Big bank traders rarely rely on charts or news alone (ForTraders).
What Is Fundamental Analysis in Forex?
Fundamental analysis looks at the big picture. It studies the money forces that make a currency go up or down.
Think of it this way. If a country’s economy is booming, investors want its currency. That pushes the price up. If the economy slows down, investors sell. The price drops.
Key data points include interest rates, inflation (CPI), and GDP. Job numbers like Non-Farm Payrolls matter too. Global news events also move prices fast. Trade wars, elections, and sanctions all cause big price swings.
For example, when the U.S. Federal Reserve raises rates, the dollar tends to strengthen. When the ECB holds rates steady, the euro may weaken.
What Is Technical Analysis in Forex?
Technical analysis reads price charts. It uses past price action to guess where the price goes next.
Traders look at patterns, trends, and indicators. Common tools include moving averages, RSI, and MACD. Bollinger Bands and support/resistance levels are also popular.
The core idea is simple. Price shows all known facts. If a pattern has played out many times, it may play out again.
Technical analysis works best for timing. It tells you where to enter and where to exit. It also shows where to place your stop-loss.
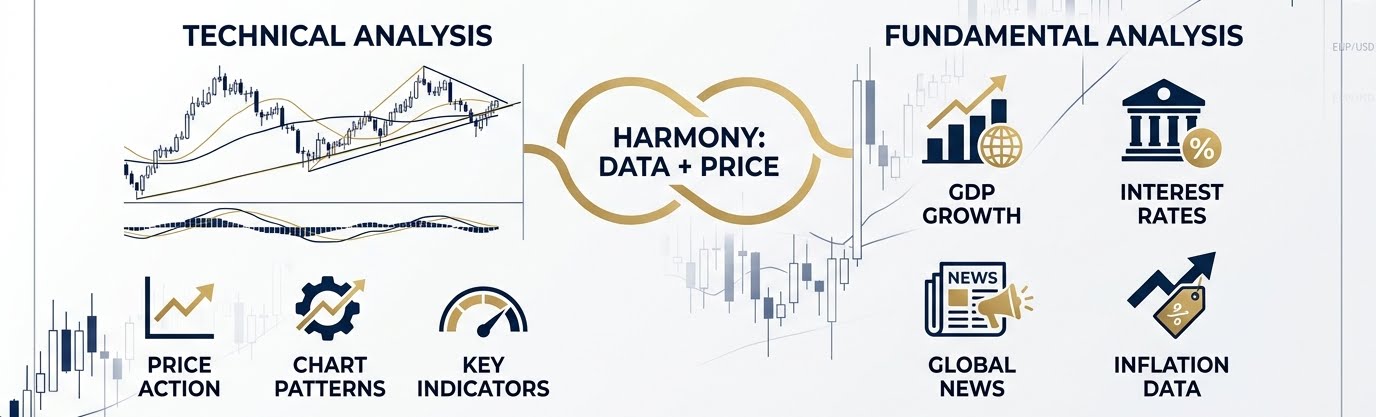
How the Two Methods Work Together
Here is where the real edge comes in. Each method fills the gap the other one leaves.
Fundamental analysis answers: “Which direction should I trade?”
Technical analysis answers: “Where do I get in?”
Say U.S. jobs data comes in strong. That points to a stronger dollar. You now have a real reason to buy USD. But you do not just jump in. You wait. You check the EUR/USD chart for a dip to support. When price hits that level and bounces, you take the trade.
Now your trade has two things going for it. The news backs your pick. The chart backs your entry price.
Practical Framework: A Step-by-Step Approach
This simple workflow helps you combine both methods.
Step 1: Check the economic calendar. Note upcoming rate decisions, jobs reports, or inflation data.
Step 2: Find out which currencies are strong or weak based on recent data.
Step 3: Pick a pair with one strong and one weak currency.
Step 4: Open the chart. Look for trend direction and support levels. Check if indicators confirm your fundamental bias.
Step 5: Enter only when both methods agree. Set your stop-loss below the nearest chart level. Set your target at the next key price zone.
Comparing Technical and Fundamental Analysis
| Feature | Technical Analysis | Fundamental Analysis |
| Focus | Price charts and patterns | Economic data and news |
| Time horizon | Short to medium term | Medium to long term |
| Key tools | RSI, MACD, moving averages | Interest rates, GDP, CPI |
| Best for | Timing entries and exits | Choosing direction and pairs |
| Weakness | Ignores economic context | Poor at pinpointing entries |
| When combined | Precise entries with context | Direction backed by data |
Common Mistakes to Avoid
Many traders try to use both methods but fall into traps. Knowing the traps helps you dodge them.
- Trading against the fundamental trend using only chart patterns. A bullish pattern means little if the central bank just cut rates.
- Ignoring the economic calendar before entering a trade. A surprise news release can wipe out a technical setup in seconds.
- Using too much leverage when both signals agree. High trust does not mean zero risk. The CFTC reports show too much leverage is a top reason traders lose.
- Forcing a trade when the two methods clash. If the signals fight each other, cut your size or sit it out.
Managing Risk With Both Methods
Risk control is where using both methods shines the most.
Fundamental analysis warns you about coming price swings. If a Fed rate call is due, you know to be careful. You might cut your trade size or stay out until after the event.
Charts give you exact levels. Your stop-loss goes below a support line. Your profit target sits near the next key zone.
Together, they create a plan with clear rules. You know why you are in the trade. You know where it fails. You know where you take profit. That structure helps control drawdowns.
The NFA data backs this up. Traders who make money use low leverage and strict rules. Using both methods helps keep you on track.
Frequently Asked Questions
Can I use combined analysis if I only trade on a phone?
Yes. Most modern trading apps include calendars and charts. Apps with news feeds and real-time charts make it easy. You can check both methods before trading on mobile.
How does combined analysis differ from sentiment analysis?
Sentiment analysis measures how other traders are positioned. Combined analysis blends economic data with price charts instead. Sentiment can be a useful third layer on top of both.
Is combined analysis useful for scalping or only swing trading?
It helps both styles. Scalpers use news to avoid bad timing. Swing traders use news for direction and charts for entry. The real gap is the time frame, not the method.
Disclaimer: This article is for informational purposes only. It is not financial advice. Always do your own research.
Post Disclaimer
The information provided on Financepdia.com is for educational and informational purposes only and should not be considered financial, investment, or trading advice. Cryptocurrency and financial markets are highly volatile and involve significant risk. Readers should conduct their own research (DYOR) and consult with a qualified financial advisor before making any investment decisions. Financepdia.com and its authors are not responsible for any financial losses resulting from actions taken based on the information provided on this website.